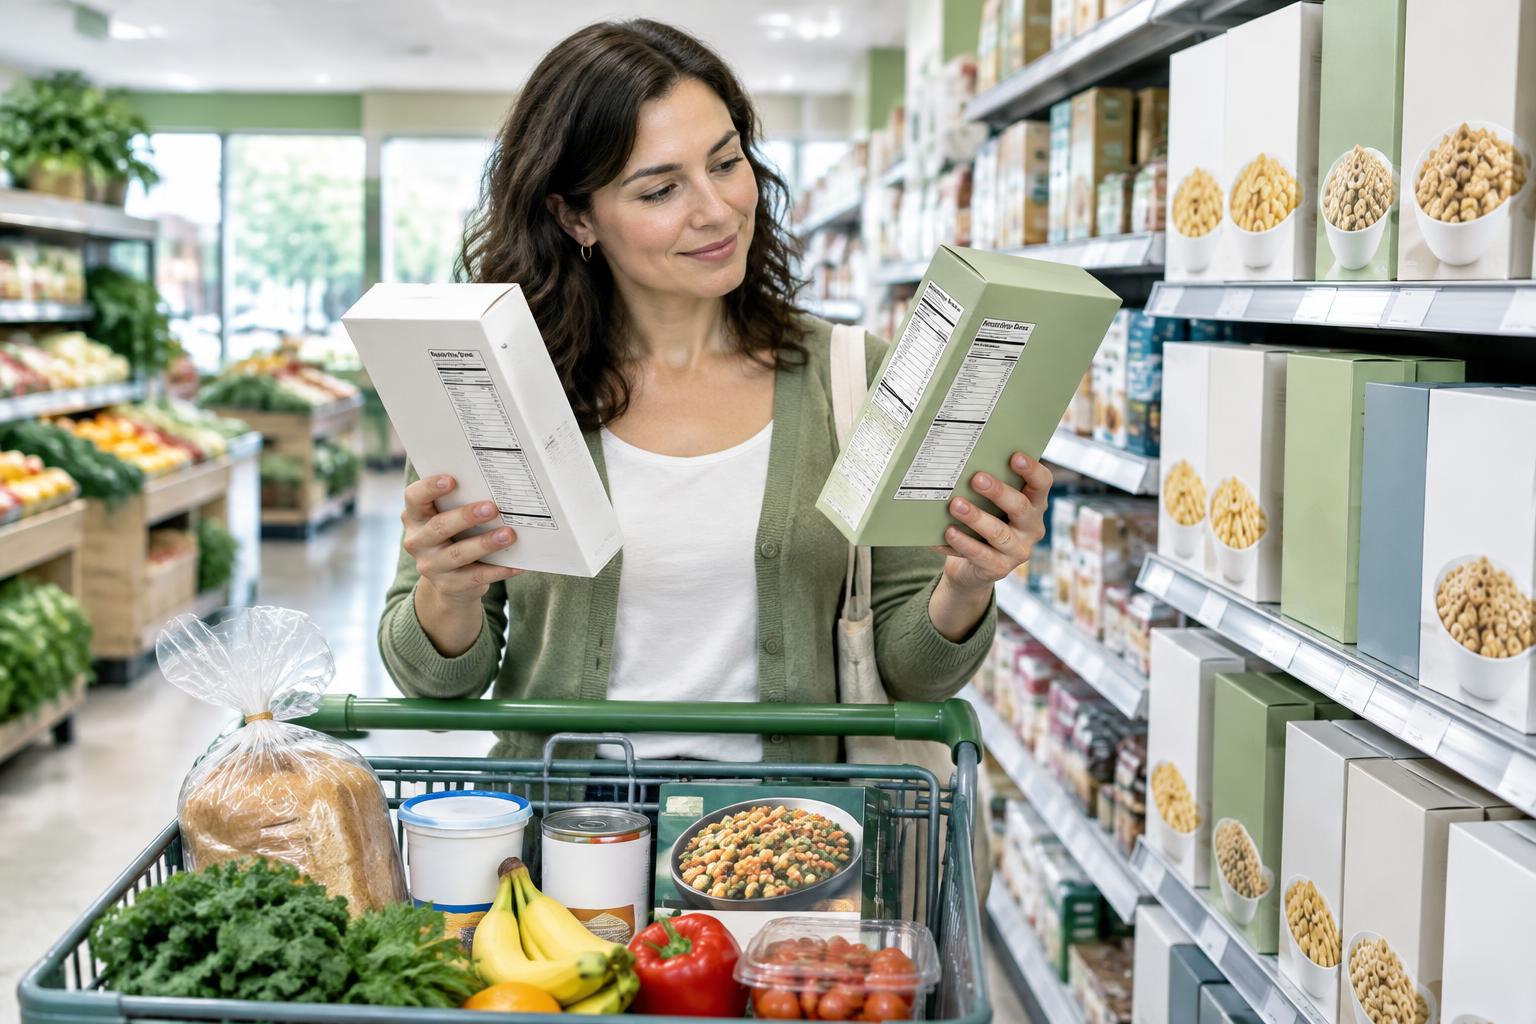
A shopper comparing two unbranded cereal cartons in a grocery aisle
Lessons / Healthy Eating

Reading a Nutrition Label

How to understand what’s really in packaged foods and drinks

A nutrition label can tell you much more than just calories. It can help you compare foods, spot hidden sodium or added sugars, understand serving sizes, and make choices that better support your health goals. Once you know what each section means, labels become one of the most powerful shopping tools you have.

A label only makes sense if you first know the serving size.

General education about U.S. FDA food labels, not personal medical advice or a compliance checklist. All example numbers and ingredient lists on this page are invented for teaching, not measured products. Photos illustrate food categories; they do not establish nutrition. Your needs may differ, especially for diabetes, kidney disease, pregnancy or childhood. Follow your care team’s guidance.

Know the Label from Top to Bottom

Here’s what to look for—and why each part matters. Start at the top before looking down the right-hand percentage column.

Nutrition Facts

8 servings per container

Serving size1 cup (40 g)

Amount per serving

Calories150

% Daily Value*

Total Fat 3g4%

Saturated Fat 0.5g3%

Trans Fat 0g

Cholesterol 0mg0%

Sodium 140mg6%

Total Carbohydrate 28g10%

Dietary Fiber 5g18%

Total Sugars 3g

Includes Added Sugars 2g4%

Protein 5g

Vitamin D 2mcg10%

Calcium 130mg10%

Iron 3.6mg20%

Potassium 190mg4%

*The % Daily Value (DV) tells you how much a nutrient in a serving of food contributes to a daily diet. 2,000 calories a day is used for general nutrition advice.

Teaching example only. Not a real product label. Displayed percentages are rounded from general adult DVs; protein %DV is not calculated.

Ingredients: Whole grain oats, wheat bran, sugar, salt

AServings per container

How many servings are in the package.

This matters because… One package is not always one serving. A family bag, can or bottle may contain several.

Here’s what to look for: Eating two servings? Multiply every nutrient and the calories by two.

BServing size

The labeled amount, shown in a familiar measure and grams or milliliters.

This matters because… Serving size reflects what people typically eat or drink—not a recommendation. Every number below uses this amount.

Here’s what to look for: Match the portion first. A tiny serving can make a product look lighter than it really is.

CCalories

The energy in one labeled serving.

This matters because… They help you understand portion impact, but they cannot tell you everything about a food’s quality.

Here’s what to look for: FDA’s teaching guide calls 100 calories moderate and 400 or more high for an individual packaged food. These are not personal targets.

D% Daily Value (%DV)

How much a serving contributes to a daily nutrient reference amount.

This matters because… 5% DV or less is low; 20% DV or more is high. The footnote uses a 2,000-calorie reference, not everyone’s calorie needs.

Here’s what to look for: For nutrients to limit, lower often helps. For fiber, a higher percentage may be useful. A percentage is not a personal prescription.

ETotal fat

All fat in a serving, including saturated, trans and unsaturated types.

This matters because… Fat adds energy. The type of fat matters as well as the total.

Here’s what to look for: Look at saturated fat too; a food rich in unsaturated fat is not automatically a weaker choice.

FSaturated fat

A fat found in foods such as butter, fatty meats and some dairy products.

This matters because… Limiting saturated fat is part of heart-conscious eating patterns.

Here’s what to look for: Compare similar products and choose less saturated fat when practical.

GTrans fat

A separate fat line without an established %DV.

This matters because… Less than 0.5 g per serving may round to 0 g. Naturally occurring trans fat is still possible.

Here’s what to look for: Partially hydrogenated oils are no longer generally recognized as safe in U.S. foods. Check ingredients where relevant; 0 g is not proof of absolute zero.

HCholesterol

Dietary cholesterol, measured in milligrams (mg).

This matters because… Some people monitor it with their care team. Do not judge heart-health fit by this number alone.

Here’s what to look for: Consider saturated fat and the whole eating pattern alongside cholesterol.

ISodium

A mineral listed in mg—not the weight of salt.

This matters because… Bread, soup, sauces, condiments and frozen meals can contribute more than expected.

Here’s what to look for: The general label DV is 2,300 mg. A soup at 800 mg is about 35% DV for one serving, and twice that for two.

JTotal carbohydrate

The big picture: starches, dietary fiber and sugars are included here.

This matters because… For blood-sugar awareness, portion and total carbohydrate matter—not added sugar alone.

Here’s what to look for: Use your care team’s approach to carbohydrate. Do not assume a low-sugar product is automatically a personal diabetes fit.

KDietary fiber

A carbohydrate found in foods such as whole grains, beans, vegetables and fruit.

This matters because… Fiber is generally a nutrient to get more of and can support a satisfying eating pattern.

Here’s what to look for: The general label DV is 28 g. Compare fiber across similar portions.

LTotal sugars

Naturally occurring sugars plus added sugars.

This matters because… Milk and fruit can contain sugar even when none is added. Total sugars has no established %DV.

Here’s what to look for: Read the added-sugars line underneath. Do not add those grams to total sugars again.

MAdded sugars

Sugars added during processing or preparation, including honey or syrups used to sweeten foods.

This matters because… Two products can have similar total sugar but very different amounts of added sugar.

Here’s what to look for: The general label DV is 50 g. “Includes 10 g Added Sugars” means those 10 g are already inside the total sugars.

NProtein

The grams of protein in one serving.

This matters because… It can help you compare yogurt, cereal, breads, snacks and meal options for balance.

Here’s what to look for: A %DV is often not shown on ordinary adult food labels. Its calculation involves protein quality, so grams are the practical comparison here.

OVitamin D, calcium, iron & potassium

Four required vitamins and minerals on current standard labels.

This matters because… They give a broader picture beyond calories. Other nutrients may appear too.

Here’s what to look for: Not every food must be high in every nutrient. Kidney-related potassium limits need personal guidance.

PThe footnote

Explains how a serving contributes to a daily diet and mentions 2,000 calories.

This matters because… It provides context for the percentage column.

Here’s what to look for: Label reference amounts are not individualized recommendations. There is no %DV for calories, total sugars or trans fat.

The most important thing: start with the serving

A label only makes sense if you first know the serving size. Check the number of servings in the container, then think about the amount you will actually eat.

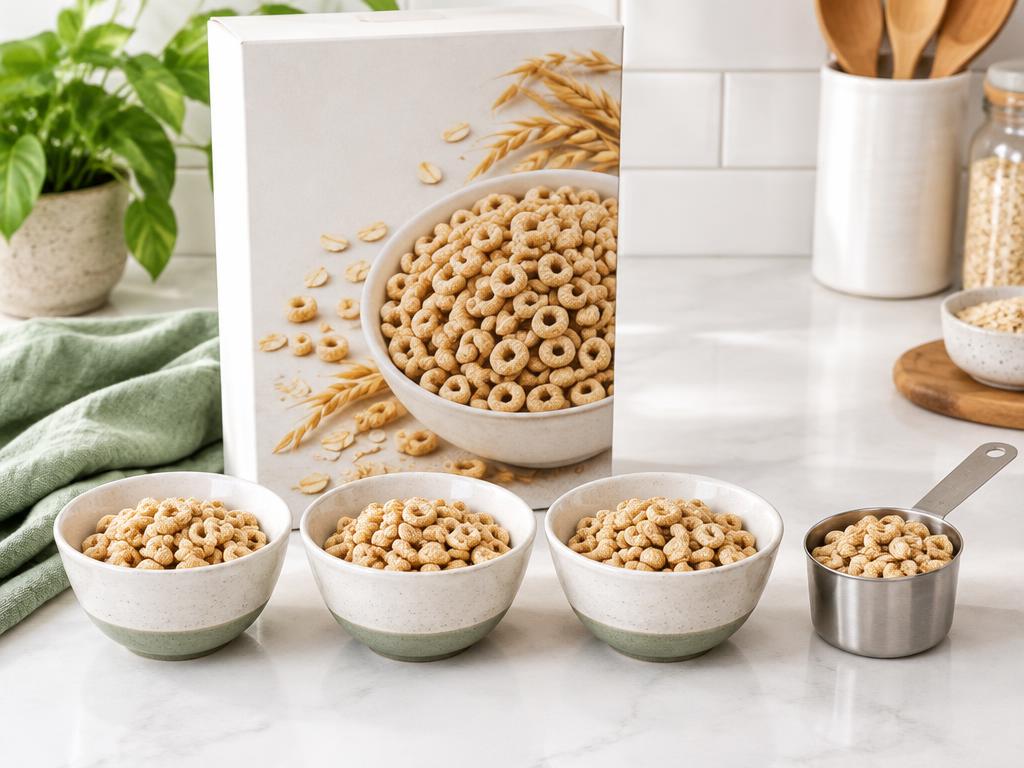
Our teaching cereal has eight 1-cup servings. Two cups mean twice the calories, sodium, carbohydrate, fiber, sugars and protein—not twice the serving size written on the package.

  • One serving: 150 calories, 140 mg sodium, 28 g total carbohydrate.
  • Two servings: 300 calories, 280 mg sodium, 56 g total carbohydrate.
  • Eight servings, the whole box: 1,200 calories, 1,120 mg sodium, 224 g total carbohydrate.
Cereal bowls and a measuring cup beside a cereal box
Think about your portion, not just the package.

A quick %DV guide

5% or less is low. 20% or more is high. In between is neither.

5%

Low %DV

20%

High %DV

Use the guide to compare nutrients, not to grade an entire food. Lower sodium or saturated fat may help a goal; higher fiber may be useful. The same percentage means different things for different nutrients.

Calories are a starting point—not the whole story

A quick glance can tell you a lot, but calories alone miss fiber, protein, fat quality, sodium and added sugars. Foods with different textures and portions are not always meaningful direct comparisons.

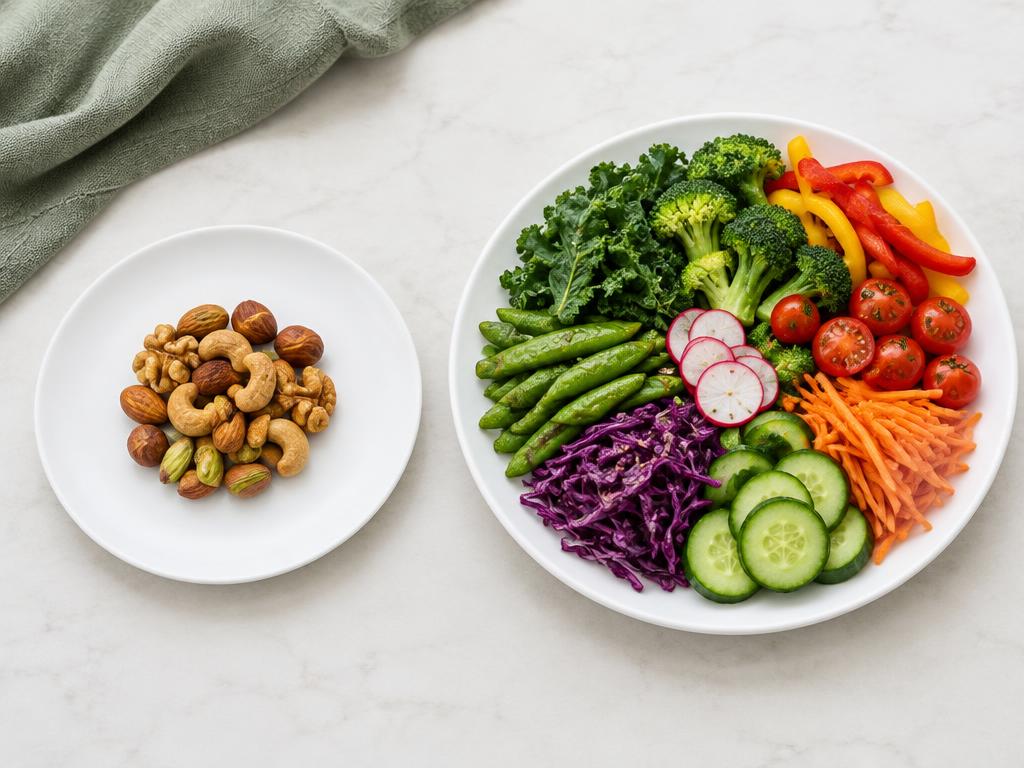
  • A serving that looks small can still be calorie-dense.
  • A lower-calorie food is not automatically the more nourishing or satisfying option.
  • Compare similar foods, then consider how each fits the meal.
A small portion of nuts beside a plate of vegetables
Different foods have different energy densities; these portions are not measured equivalents.

The Label Is More Than the Label

Generally, ingredients appear in descending order by weight, from most to least. This does not tell you exact percentages. The first few ingredients offer useful clues.

For allergies, check the ingredient list and any “Contains” statement each time. The nine major U.S. allergens are milk, eggs, fish, crustacean shellfish, tree nuts, peanuts, wheat, soybeans and sesame. Advisory “may contain” statements are voluntary; their absence is not a safety guarantee.

  • “Made with whole grain” does not tell you how much whole grain the product contains.
  • “Multigrain” means more than one grain, not necessarily whole grains.
  • “Low fat” may still have plenty of added sugar. “Reduced sodium” compares with a reference product; it does not necessarily mean low sodium.
  • “Natural” and “organic” do not establish a healthier nutrient profile. “Gluten-free” can matter for medical needs, but is not an overall nutrition grade.
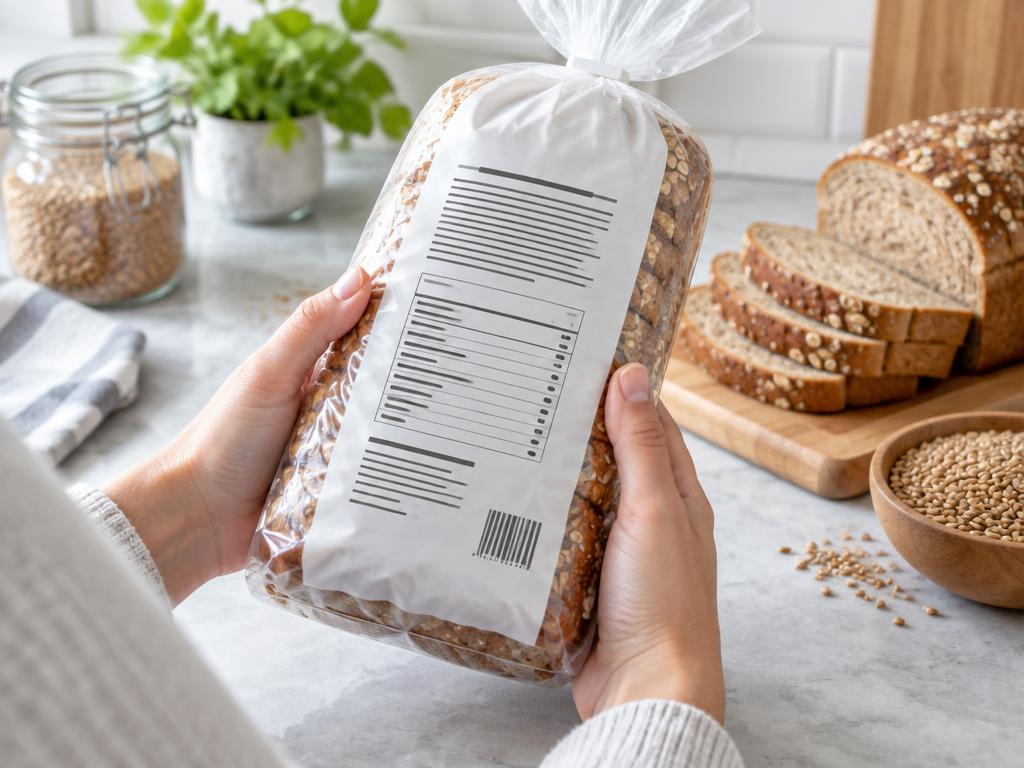
Hands examining the back of a bread package
Ingredients and allergens provide context beyond the facts panel.

Nutrition Labels Come in Different Forms

These unbranded food photos and mock label formats explain what makes each package tricky. Real packaging may differ.

Standard Nutrition Facts

The familiar vertical panel uses one labeled serving. The large calories line and right-hand %DV column help you scan.

Nutrition Facts

8 servings per container

Serving size1 cup (40 g)

Amount per serving

Calories150

% Daily Value*

Total Fat 3g4%

Saturated Fat 0.5g3%

Trans Fat 0g

Cholesterol 0mg0%

Sodium 140mg6%

Total Carbohydrate 28g10%

Dietary Fiber 5g18%

Total Sugars 3g

Includes Added Sugars 2g4%

Protein 5g

Vitamin D 2mcg10%

Calcium 130mg10%

Iron 3.6mg20%

Potassium 190mg4%

*The % Daily Value (DV) tells you how much a nutrient in a serving of food contributes to a daily diet. 2,000 calories a day is used for general nutrition advice.

Teaching example only. Not a real product label. Displayed percentages are rounded from general adult DVs; protein %DV is not calculated.

Dual-column label

Some packages show per serving and per package or unit. Use the column matching the amount eaten; not every multi-serving food requires both.

Nutrition Facts

Per servingPer box
Calories1501200
Sodium mg1401120
Carbs g28224
Added sugars g216

Teaching excerpt · 8 servings per box

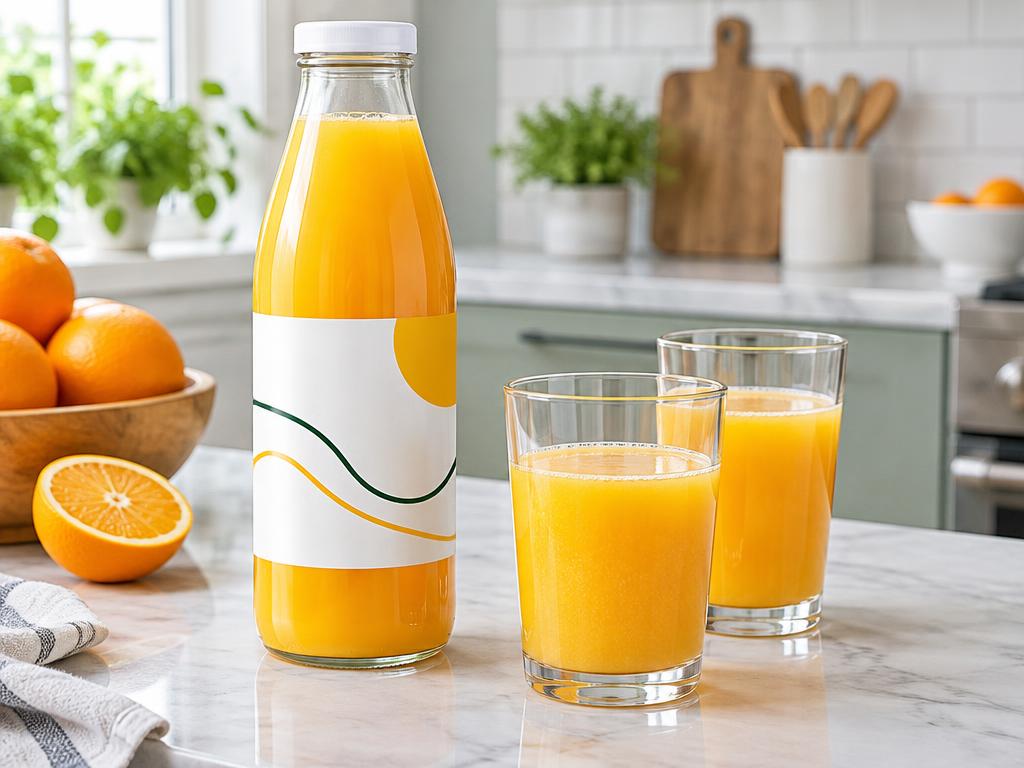
A large juice bottle beside drinking glasses
Check whether the full bottle is one serving.

Beverage bottle

Check whether the whole bottle is one serving. A bottle that looks single-use can still need a closer look.

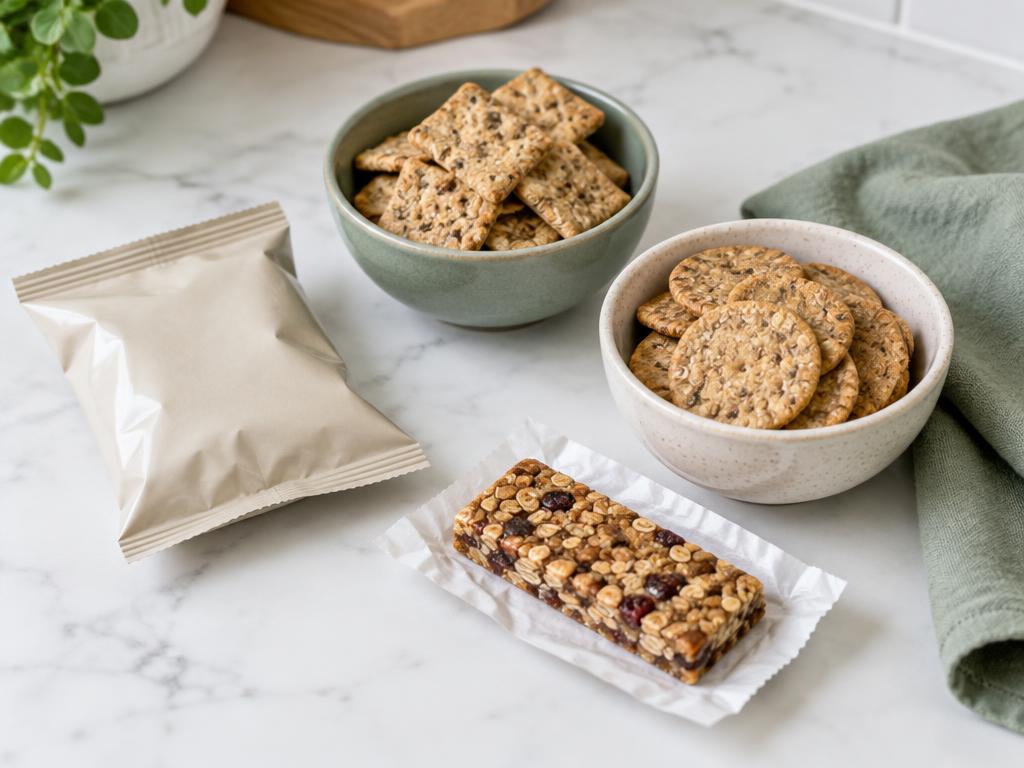
Crackers and an unwrapped snack bar beside a small bag
Even a small package can hold more than one serving.

Small package

Space-saving tabular or linear formats may look different. Read carefully for portion and omitted lines; do not assume an absent value means zero.

Teaching linear excerpt: Serving 1 cup (40 g); Calories 150; Fat 3 g; Sodium 140 mg (6% DV); Carbs 28 g; Fiber 5 g; Total sugars 3 g; Includes 2 g added sugars (4% DV); Protein 5 g.

Cereal bowls and a measuring cup beside a cereal box
Think about your portion, not just the package.

Family-size package

A serving is not the entire family bag or box. Count the portions actually eaten.

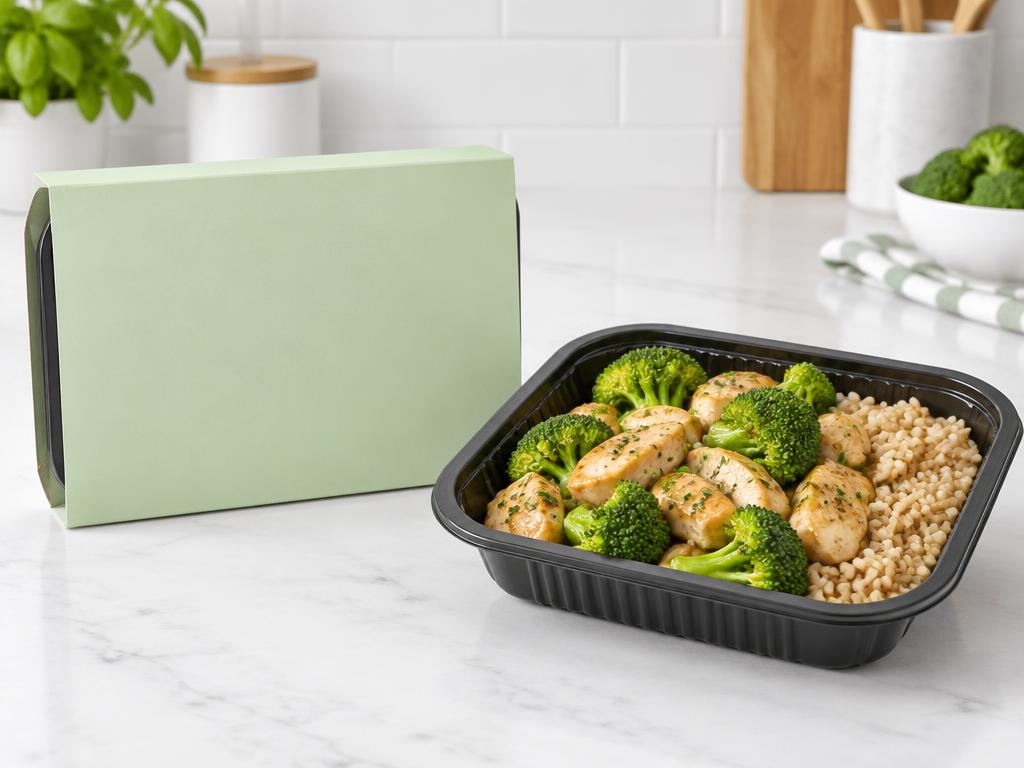
An unbranded frozen meal with chicken, broccoli and rice
A meal comparison needs more than the calorie line.

Frozen meal

Some trays are one serving; others contain more. Check sodium and saturated fat alongside protein and fiber.

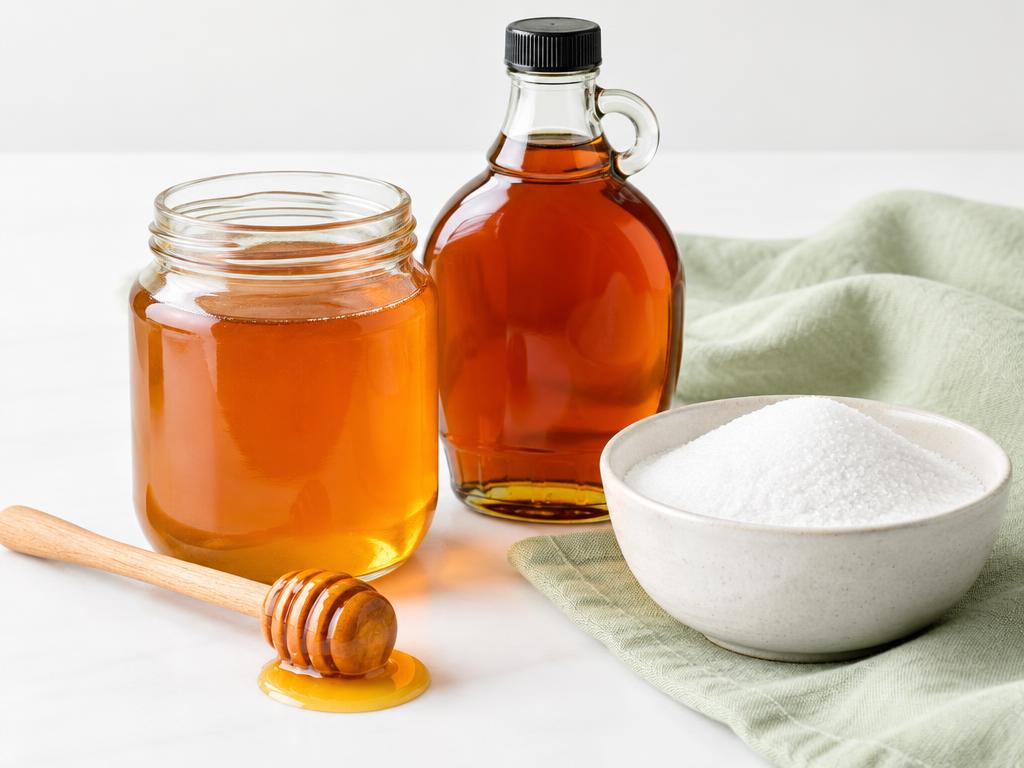
Honey, maple syrup and granulated sugar
Pure sugars and syrups have a special label format, not a sugar exemption.

Pure sugar, honey or syrup

Pure single-ingredient sugars and syrups have a special FDA format: added-sugars %DV is still shown, but grams need not appear in the usual “Includes” line. An explanatory footnote may be used. This does not mean no added sugar.

Special-format teaching excerpt: Total sugars 17 g · Added sugars 34% DV†. †One serving contributes 17 g added sugars to your diet (34% of the 50 g DV). No sugar was added to this pure honey during processing.

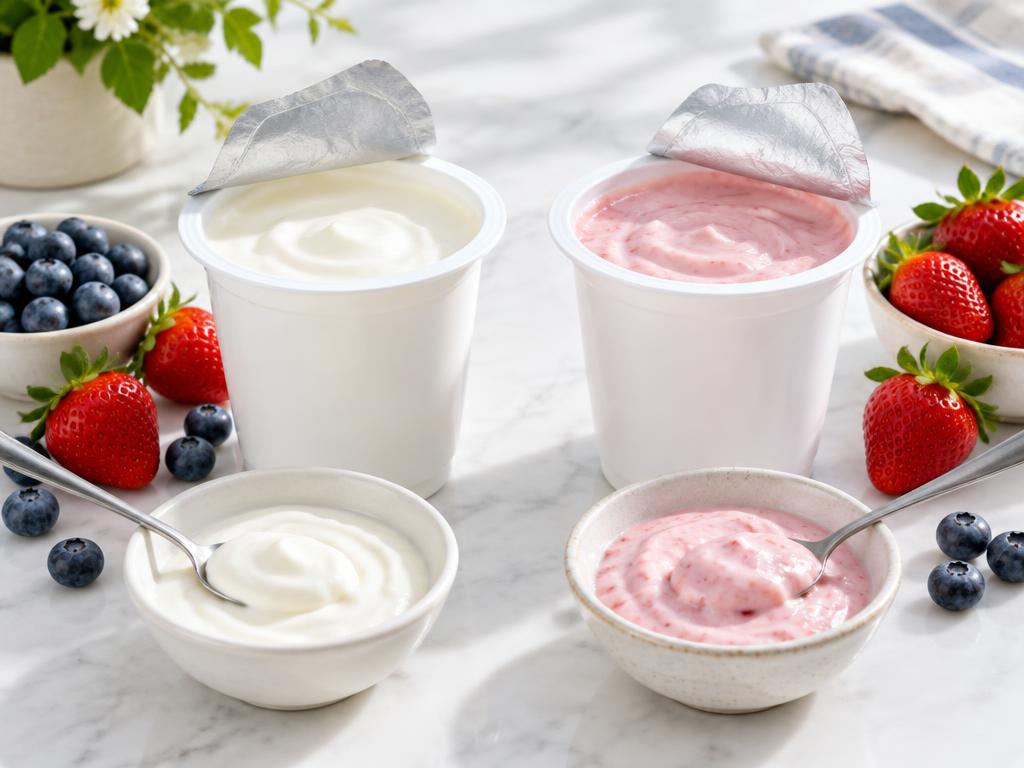
Plain and strawberry yogurt in unbranded cups
Compare total sugars, added sugars and protein.

Yogurt or dairy container

Plain milk-based yogurt can contain natural milk sugar. Flavored versions may add sugar; check both sugar lines.

Whole grain and white bread loaves
The actual nutrition panel tells you more than the color of the bread.

Bread label

One slice versus two slices changes the basis. Whole-grain claims do not replace the fiber and sodium numbers.

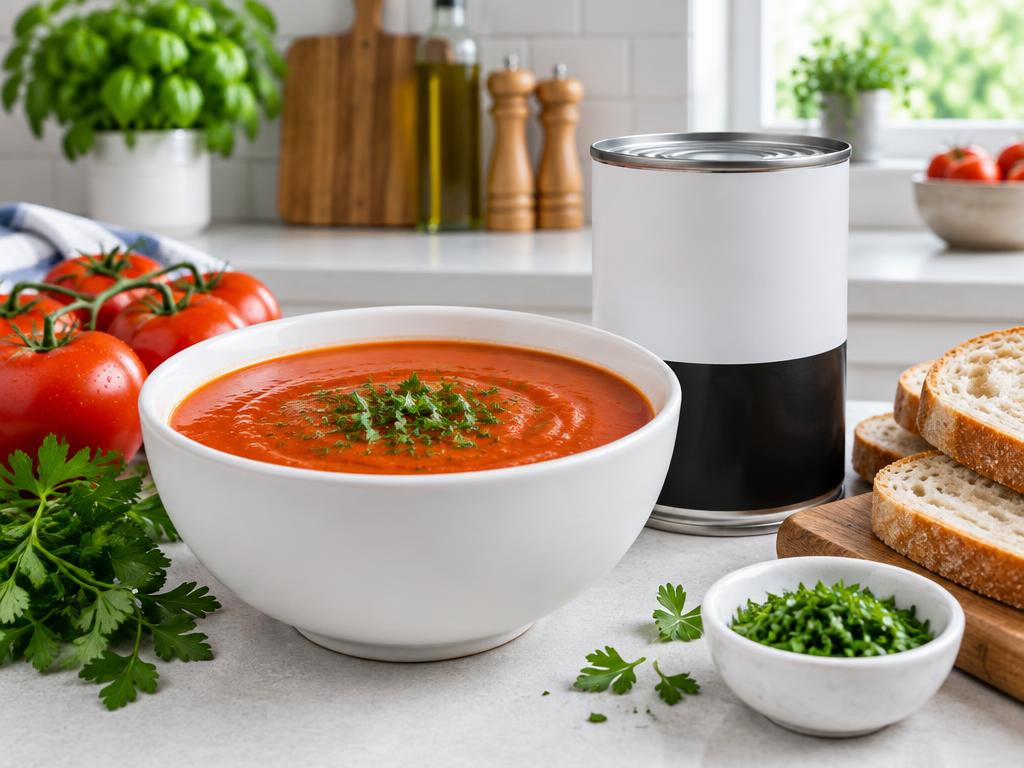
Tomato soup beside an unbranded soup can
Soup is a useful place to compare sodium per serving.

Soup or canned food

A can may contain two or more servings. Check whether figures are for condensed or prepared soup.

Crackers and an unwrapped snack bar beside a small bag
Even a small package can hold more than one serving.

Snack food

A small bag is not always one portion. Bars and crackers vary in fiber, sodium and added sugar.

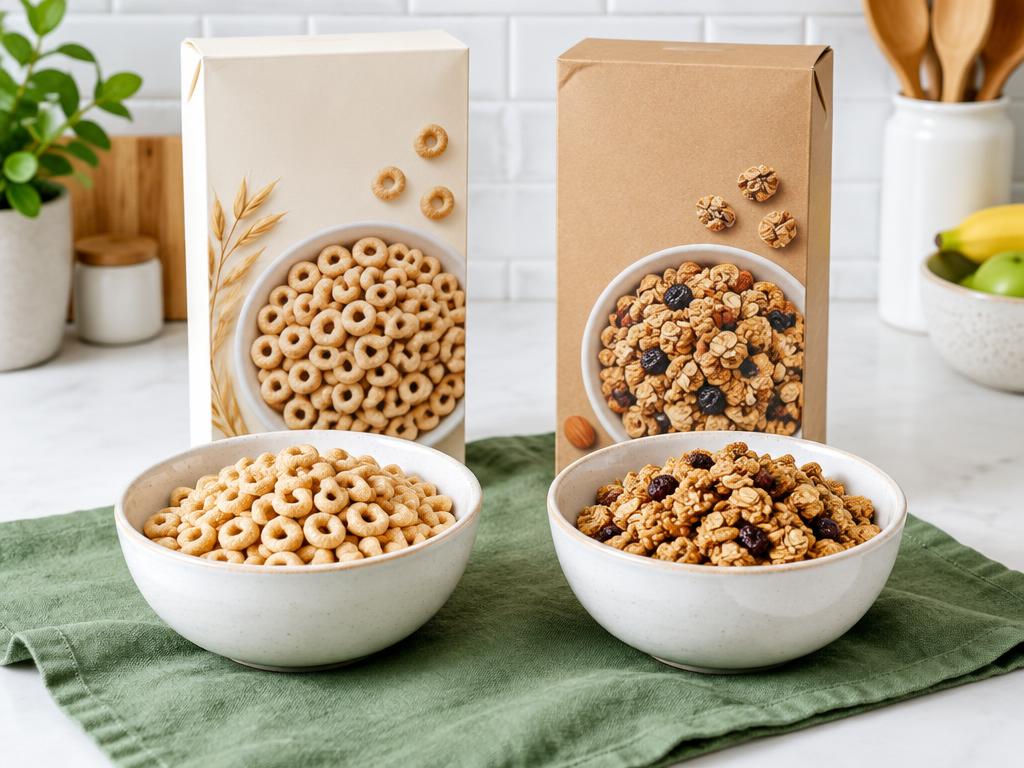
Two cereal boxes with oat cereal and granola
Compare serving weights, fiber and added sugars.

Cereal

Cup measures and gram weights vary. Check whether a second column adds milk; compare cereals on the same basis.

What to Watch Closely for Heart-Healthy Eating

Start with serving size. Then use several numbers together, rather than searching for one perfect food.

  • Calories: consider the portion and the rest of the meal, especially for weight-management goals.
  • Saturated fat and sodium: compare similar foods; lower can support a heart-conscious pattern.
  • Total carbohydrate: useful for meal planning and blood-sugar awareness; personal needs and medication matter.
  • Fiber: look for whole grains, beans, vegetables and fruit where appropriate.
  • Added sugars: compare the grams and %DV, without forgetting total carbohydrate.
  • Protein: useful for satisfying meal and snack balance; requirements vary.
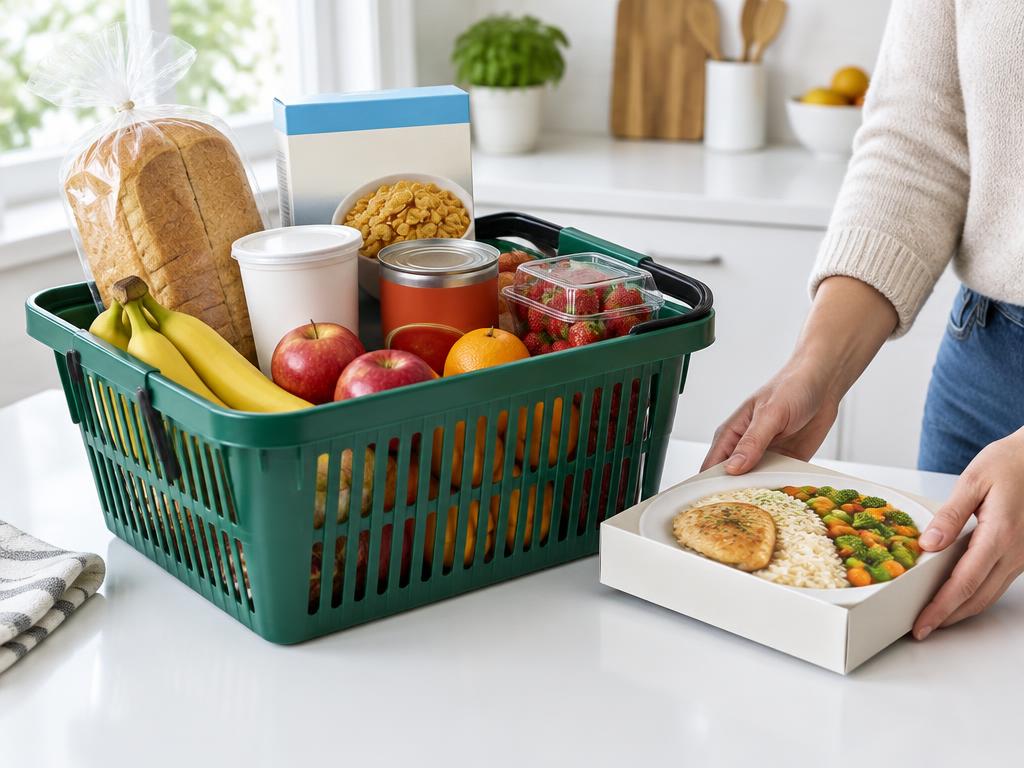
A basket of packaged foods and fresh produce
Packaged foods can fit a thoughtful, practical eating pattern.

Sodium can hide in everyday foods

This is one of the biggest surprises: bread, sauce or a frozen meal may contribute sodium without tasting especially salty.

In the teaching soup comparison, 800 mg per cup is about 35% DV; 350 mg is about 15% DV. The second is lower, but not “low” by the 5% DV guide.

  • Read mg and %DV for the portion you eat.
  • Two cups of the 800 mg soup contribute 1,600 mg sodium—about 70% DV.
  • A lower-sodium sale item can be a better fit, but “on sale” says nothing about its nutrition.
Tomato soup beside an unbranded soup can
Soup is a useful place to compare sodium per serving.

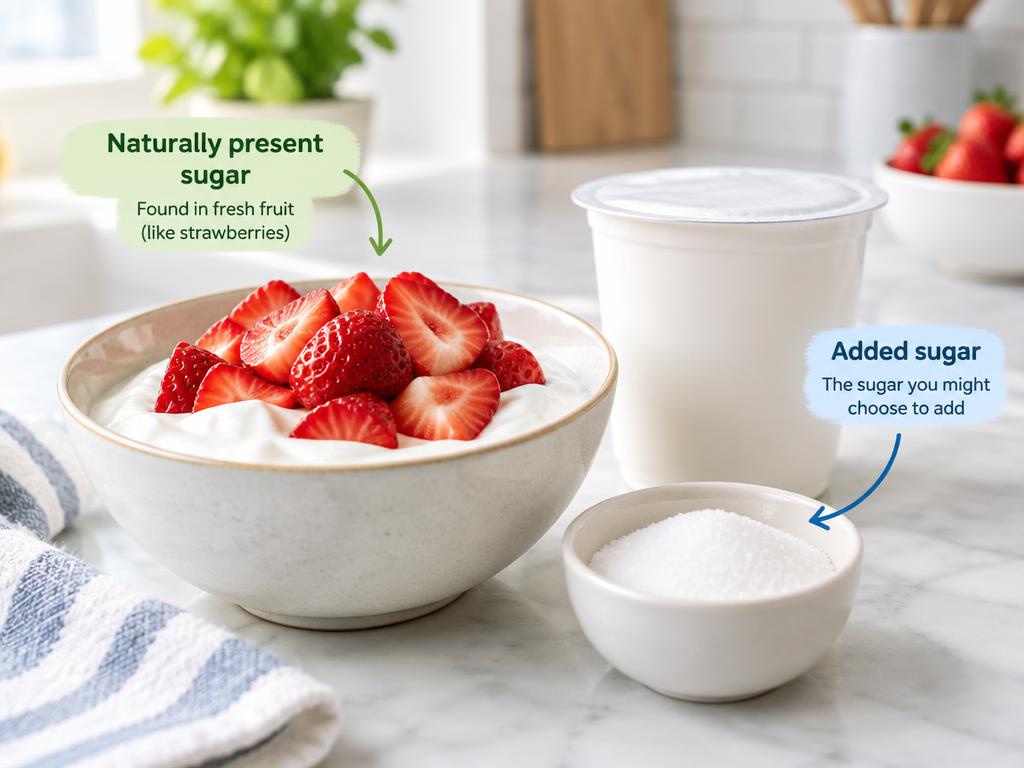
Total sugars and added sugars are not the same

Naturally present sugar in milk or fruit appears in total sugars. Added sugars are included within that total, not stacked on top of it.

If a yogurt lists 20 g total sugars and includes 12 g added sugars, the total is still 20 g—not 32 g. The remaining 8 g is not classified as added in this teaching example.

  • Plain yogurt may have total sugar with 0 g added sugar.
  • Honey or syrup added to another food counts as added sugar.
  • For diabetes awareness, check total carbohydrate and the amount eaten too.
Yogurt with strawberries beside a bowl of sugar
Naturally present and added sugars both belong in total sugars.

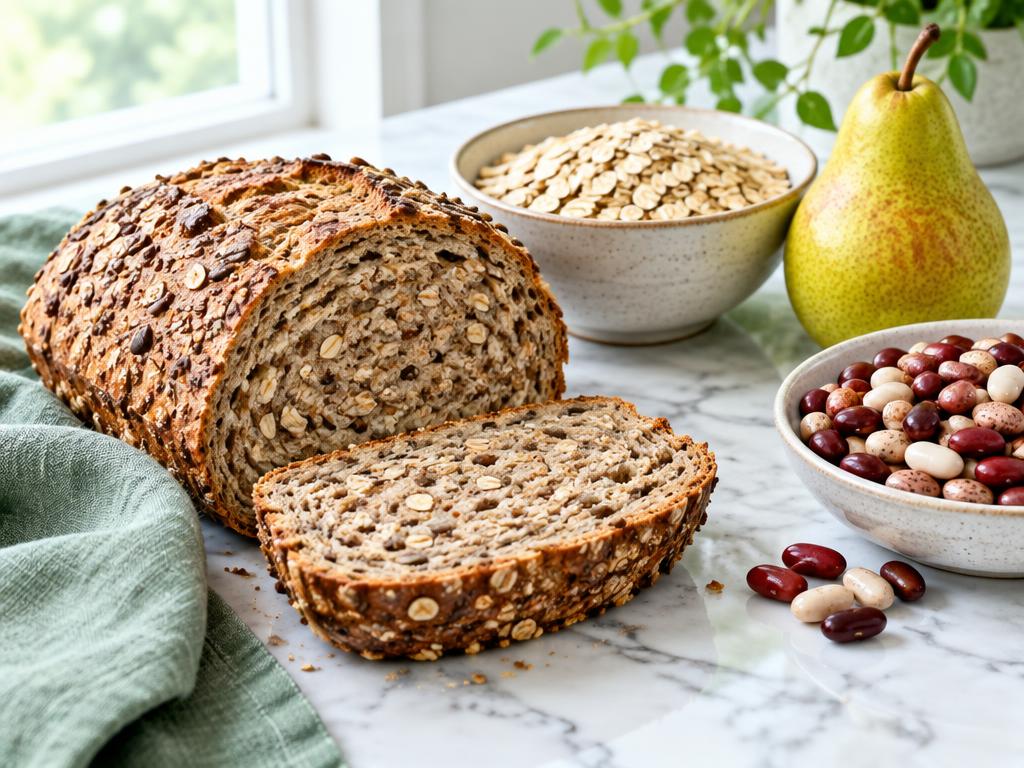
Fiber helps you compare beyond the front of the box

Whole grains, beans and fruit can provide fiber. Packaging color and words such as “grain” do not tell you the grams.

  • The two 40 g cereals below have 1 g versus 5 g fiber.
  • Check the ingredient list as well as the fiber line.
  • More fiber is a useful comparison, not a guarantee of a personal health outcome.
Whole grain bread, oats, beans and a pear
Check fiber grams rather than relying on package appearance.

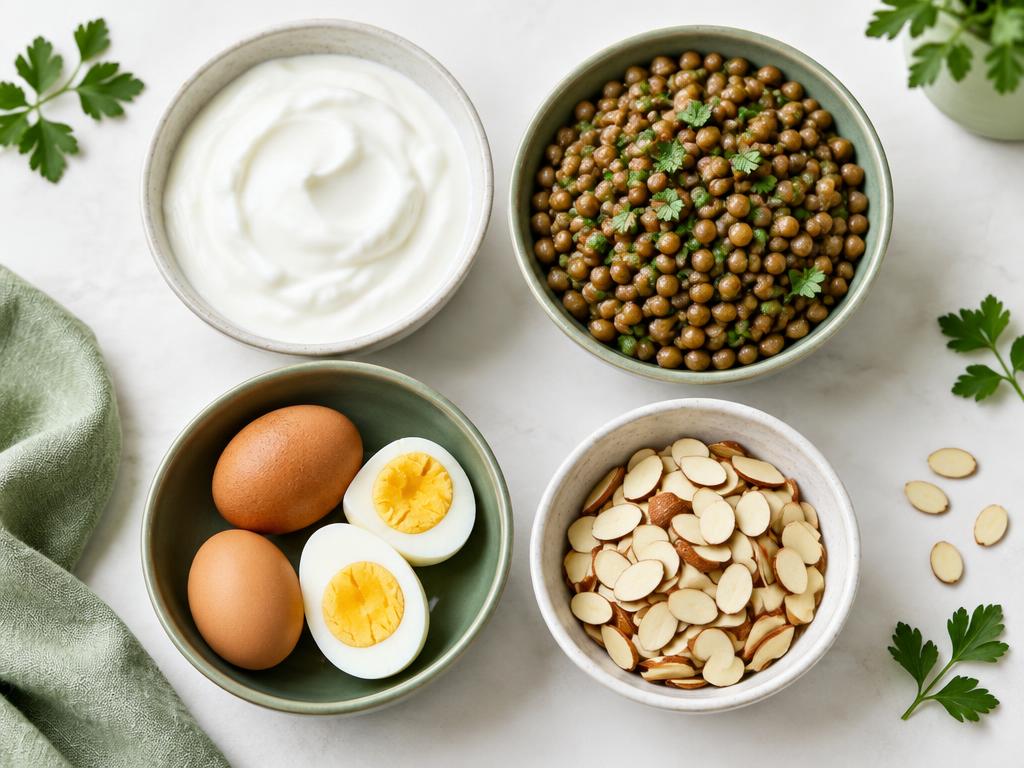
Protein can help with meal balance

Yogurt, eggs, lentils and nuts illustrate different protein foods, not measured equivalents. A label makes it easier to compare packaged options.

  • The teaching yogurts provide 10 g versus 17 g protein at the same 170 g portion.
  • Higher protein does not erase high sodium, added sugar or saturated fat.
  • Personal protein needs can differ; kidney care may require a different plan.
Bowls of yogurt, lentils, eggs and almonds
Protein foods vary; these photos do not show equal protein portions.

How to Compare Foods Side by Side

Once you know this sequence, comparing products gets much easier. If servings differ, compare a common amount or the portion you intend to eat.

  • 1. Check serving size and servings per container.
  • 2. Compare calories for the same amount.
  • 3. Compare sodium.
  • 4. Compare saturated fat.
  • 5. Compare fiber.
  • 6. Compare added sugars; for blood-sugar awareness, include total carbohydrate.
  • 7. Compare protein if relevant.
  • 8. Look at ingredients and allergens.

All comparisons are invented teaching examples. Each pair uses the same weight and intended portion.

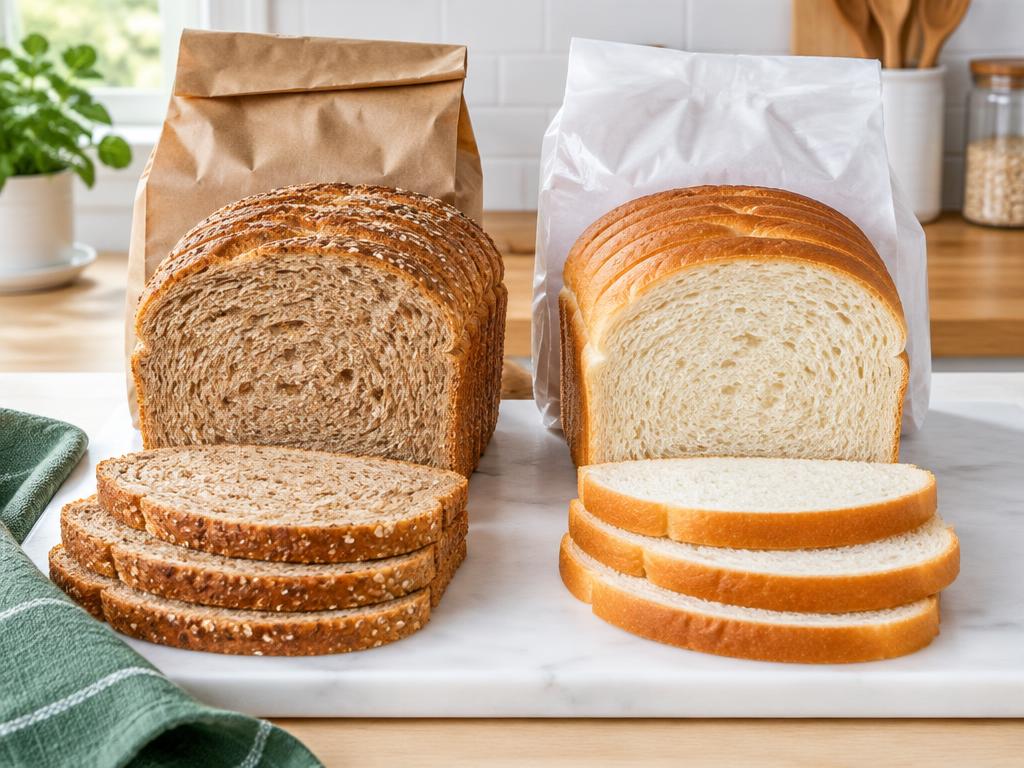
Two breads

At 40 g per slice, Bread B has 90 mg less sodium, 2 g more fiber and 2 g less added sugar. It is a stronger fit for these goals; check actual labels and allergens.

Whole grain and white bread loaves
The actual nutrition panel tells you more than the color of the bread.

Bread A · soft multigrain

Nutrition Facts

1 servings per container

Serving size1 slice (40 g)

Amount per serving

Calories110

% Daily Value*

Total Fat 1.5g2%

Saturated Fat 0g0%

Trans Fat 0g

Cholesterol 0mg0%

Sodium 210mg9%

Total Carbohydrate 21g8%

Dietary Fiber 1g4%

Total Sugars 4g

Includes Added Sugars 3g6%

Protein 3g

Vitamin D 0mcg0%

Calcium 40mg3%

Iron 1.8mg10%

Potassium 120mg3%

*The % Daily Value (DV) tells you how much a nutrient in a serving of food contributes to a daily diet. 2,000 calories a day is used for general nutrition advice.

Teaching example only. Not a real product label. Displayed percentages are rounded from general adult DVs; protein %DV is not calculated.

Ingredients: Enriched wheat flour, water, sugar, whole wheat flour, yeast, salt

Bread B · whole wheat

Nutrition Facts

1 servings per container

Serving size1 slice (40 g)

Amount per serving

Calories100

% Daily Value*

Total Fat 1.5g2%

Saturated Fat 0g0%

Trans Fat 0g

Cholesterol 0mg0%

Sodium 120mg5%

Total Carbohydrate 19g7%

Dietary Fiber 3g11%

Total Sugars 2g

Includes Added Sugars 1g2%

Protein 4g

Vitamin D 0mcg0%

Calcium 40mg3%

Iron 1.8mg10%

Potassium 120mg3%

*The % Daily Value (DV) tells you how much a nutrient in a serving of food contributes to a daily diet. 2,000 calories a day is used for general nutrition advice.

Teaching example only. Not a real product label. Displayed percentages are rounded from general adult DVs; protein %DV is not calculated.

Ingredients: Whole wheat flour, water, yeast, sunflower oil, sugar, salt

Two yogurts

At 170 g, plain Yogurt B has 0 g added sugar and 17 g protein. Its 6 g total sugars is not the same as added sugar.

Plain and strawberry yogurt in unbranded cups
Compare total sugars, added sugars and protein.

Yogurt A · sweetened

Nutrition Facts

1 servings per container

Serving size1 container (170 g)

Amount per serving

Calories150

% Daily Value*

Total Fat 2g3%

Saturated Fat 1g5%

Trans Fat 0g

Cholesterol 10mg3%

Sodium 80mg3%

Total Carbohydrate 23g8%

Dietary Fiber 0g0%

Total Sugars 20g

Includes Added Sugars 12g24%

Protein 10g

Vitamin D 0mcg0%

Calcium 200mg15%

Iron 1.8mg10%

Potassium 240mg5%

*The % Daily Value (DV) tells you how much a nutrient in a serving of food contributes to a daily diet. 2,000 calories a day is used for general nutrition advice.

Teaching example only. Not a real product label. Displayed percentages are rounded from general adult DVs; protein %DV is not calculated.

Ingredients: Cultured low-fat milk, sugar, strawberries

Yogurt B · plain

Nutrition Facts

1 servings per container

Serving size1 container (170 g)

Amount per serving

Calories100

% Daily Value*

Total Fat 0g0%

Saturated Fat 0g0%

Trans Fat 0g

Cholesterol 5mg2%

Sodium 65mg3%

Total Carbohydrate 7g3%

Dietary Fiber 0g0%

Total Sugars 6g

Includes Added Sugars 0g0%

Protein 17g

Vitamin D 0mcg0%

Calcium 190mg15%

Iron 1.8mg10%

Potassium 240mg5%

*The % Daily Value (DV) tells you how much a nutrient in a serving of food contributes to a daily diet. 2,000 calories a day is used for general nutrition advice.

Teaching example only. Not a real product label. Displayed percentages are rounded from general adult DVs; protein %DV is not calculated.

Ingredients: Cultured nonfat milk

Two soups

At one cup, Soup B has 450 mg less sodium. Even that lower amount is about 15% DV—not “low” by the 5% guide.

Tomato soup beside an unbranded soup can
Soup is a useful place to compare sodium per serving.

Soup A · regular

Nutrition Facts

2 servings per container

Serving size1 cup (245 g)

Amount per serving

Calories120

% Daily Value*

Total Fat 3g4%

Saturated Fat 1g5%

Trans Fat 0g

Cholesterol 0mg0%

Sodium 800mg35%

Total Carbohydrate 18g7%

Dietary Fiber 2g7%

Total Sugars 5g

Includes Added Sugars 2g4%

Protein 5g

Vitamin D 0mcg0%

Calcium 40mg3%

Iron 1.8mg10%

Potassium 120mg3%

*The % Daily Value (DV) tells you how much a nutrient in a serving of food contributes to a daily diet. 2,000 calories a day is used for general nutrition advice.

Teaching example only. Not a real product label. Displayed percentages are rounded from general adult DVs; protein %DV is not calculated.

Ingredients: Water, tomatoes, cream, wheat flour, salt, sugar

Soup B · lower sodium

Nutrition Facts

2 servings per container

Serving size1 cup (245 g)

Amount per serving

Calories110

% Daily Value*

Total Fat 2g3%

Saturated Fat 0.5g3%

Trans Fat 0g

Cholesterol 0mg0%

Sodium 350mg15%

Total Carbohydrate 18g7%

Dietary Fiber 3g11%

Total Sugars 4g

Includes Added Sugars 0g0%

Protein 5g

Vitamin D 0mcg0%

Calcium 40mg3%

Iron 1.8mg10%

Potassium 120mg3%

*The % Daily Value (DV) tells you how much a nutrient in a serving of food contributes to a daily diet. 2,000 calories a day is used for general nutrition advice.

Teaching example only. Not a real product label. Displayed percentages are rounded from general adult DVs; protein %DV is not calculated.

Ingredients: Water, tomatoes, beans, olive oil, onion, salt

Two cereals

At 40 g, Cereal B offers 4 g more fiber and 9 g less added sugar. The calorie difference alone would miss most of this story.

Two cereal boxes with oat cereal and granola
Compare serving weights, fiber and added sugars.

Cereal A · sweet crunch

Nutrition Facts

1 servings per container

Serving size1 cup (40 g)

Amount per serving

Calories160

% Daily Value*

Total Fat 2g3%

Saturated Fat 0g0%

Trans Fat 0g

Cholesterol 0mg0%

Sodium 180mg8%

Total Carbohydrate 34g12%

Dietary Fiber 1g4%

Total Sugars 12g

Includes Added Sugars 11g22%

Protein 2g

Vitamin D 0mcg0%

Calcium 40mg3%

Iron 1.8mg10%

Potassium 120mg3%

*The % Daily Value (DV) tells you how much a nutrient in a serving of food contributes to a daily diet. 2,000 calories a day is used for general nutrition advice.

Teaching example only. Not a real product label. Displayed percentages are rounded from general adult DVs; protein %DV is not calculated.

Ingredients: Corn flour, sugar, salt

Cereal B · oat cereal

Nutrition Facts

1 servings per container

Serving size1 cup (40 g)

Amount per serving

Calories150

% Daily Value*

Total Fat 3g4%

Saturated Fat 0.5g3%

Trans Fat 0g

Cholesterol 0mg0%

Sodium 140mg6%

Total Carbohydrate 28g10%

Dietary Fiber 5g18%

Total Sugars 3g

Includes Added Sugars 2g4%

Protein 5g

Vitamin D 0mcg0%

Calcium 40mg3%

Iron 1.8mg10%

Potassium 120mg3%

*The % Daily Value (DV) tells you how much a nutrient in a serving of food contributes to a daily diet. 2,000 calories a day is used for general nutrition advice.

Teaching example only. Not a real product label. Displayed percentages are rounded from general adult DVs; protein %DV is not calculated.

Ingredients: Whole grain oats, wheat bran, sugar, salt

Two crackers

For 30 g, Crackers B provide less sodium and more fiber. “Six crackers” only compares fairly here because the weights also match.

Crackers and an unwrapped snack bar beside a small bag
Even a small package can hold more than one serving.

Crackers A

Nutrition Facts

1 servings per container

Serving size6 crackers (30 g)

Amount per serving

Calories130

% Daily Value*

Total Fat 4g5%

Saturated Fat 1g5%

Trans Fat 0g

Cholesterol 0mg0%

Sodium 240mg10%

Total Carbohydrate 21g8%

Dietary Fiber 1g4%

Total Sugars 2g

Includes Added Sugars 1g2%

Protein 2g

Vitamin D 0mcg0%

Calcium 40mg3%

Iron 1.8mg10%

Potassium 120mg3%

*The % Daily Value (DV) tells you how much a nutrient in a serving of food contributes to a daily diet. 2,000 calories a day is used for general nutrition advice.

Teaching example only. Not a real product label. Displayed percentages are rounded from general adult DVs; protein %DV is not calculated.

Ingredients: Enriched flour, oil, salt, sugar

Crackers B

Nutrition Facts

1 servings per container

Serving size6 crackers (30 g)

Amount per serving

Calories120

% Daily Value*

Total Fat 3g4%

Saturated Fat 0.5g3%

Trans Fat 0g

Cholesterol 0mg0%

Sodium 100mg4%

Total Carbohydrate 20g7%

Dietary Fiber 3g11%

Total Sugars 1g

Includes Added Sugars 0g0%

Protein 3g

Vitamin D 0mcg0%

Calcium 40mg3%

Iron 1.8mg10%

Potassium 120mg3%

*The % Daily Value (DV) tells you how much a nutrient in a serving of food contributes to a daily diet. 2,000 calories a day is used for general nutrition advice.

Teaching example only. Not a real product label. Displayed percentages are rounded from general adult DVs; protein %DV is not calculated.

Ingredients: Whole wheat flour, sunflower oil, salt

Two sauces

For 125 g, Sauce B has 340 mg less sodium and no added sugar. Tomatoes still contribute naturally present sugar.

Hands examining the back of a bread package
Ingredients and allergens provide context beyond the facts panel.

Sauce A

Nutrition Facts

1 servings per container

Serving size1/2 cup (125 g)

Amount per serving

Calories80

% Daily Value*

Total Fat 2g3%

Saturated Fat 0g0%

Trans Fat 0g

Cholesterol 0mg0%

Sodium 480mg21%

Total Carbohydrate 14g5%

Dietary Fiber 2g7%

Total Sugars 9g

Includes Added Sugars 5g10%

Protein 2g

Vitamin D 0mcg0%

Calcium 40mg3%

Iron 1.8mg10%

Potassium 120mg3%

*The % Daily Value (DV) tells you how much a nutrient in a serving of food contributes to a daily diet. 2,000 calories a day is used for general nutrition advice.

Teaching example only. Not a real product label. Displayed percentages are rounded from general adult DVs; protein %DV is not calculated.

Ingredients: Tomatoes, sugar, oil, salt

Sauce B

Nutrition Facts

1 servings per container

Serving size1/2 cup (125 g)

Amount per serving

Calories60

% Daily Value*

Total Fat 1g1%

Saturated Fat 0g0%

Trans Fat 0g

Cholesterol 0mg0%

Sodium 140mg6%

Total Carbohydrate 11g4%

Dietary Fiber 3g11%

Total Sugars 6g

Includes Added Sugars 0g0%

Protein 2g

Vitamin D 0mcg0%

Calcium 40mg3%

Iron 1.8mg10%

Potassium 120mg3%

*The % Daily Value (DV) tells you how much a nutrient in a serving of food contributes to a daily diet. 2,000 calories a day is used for general nutrition advice.

Teaching example only. Not a real product label. Displayed percentages are rounded from general adult DVs; protein %DV is not calculated.

Ingredients: Tomatoes, onion, olive oil, garlic, herbs, salt

Two frozen meals

For equal 300 g trays, Meal B has less sodium and saturated fat with more fiber and protein. Personal calorie and carbohydrate needs still matter.

An unbranded frozen meal with chicken, broccoli and rice
A meal comparison needs more than the calorie line.

Frozen meal A

Nutrition Facts

1 servings per container

Serving size1 tray (300 g)

Amount per serving

Calories450

% Daily Value*

Total Fat 18g23%

Saturated Fat 7g35%

Trans Fat 0g

Cholesterol 55mg18%

Sodium 1000mg43%

Total Carbohydrate 50g18%

Dietary Fiber 3g11%

Total Sugars 6g

Includes Added Sugars 2g4%

Protein 22g

Vitamin D 0mcg0%

Calcium 40mg3%

Iron 1.8mg10%

Potassium 120mg3%

*The % Daily Value (DV) tells you how much a nutrient in a serving of food contributes to a daily diet. 2,000 calories a day is used for general nutrition advice.

Teaching example only. Not a real product label. Displayed percentages are rounded from general adult DVs; protein %DV is not calculated.

Ingredients: Pasta, chicken, cream, cheese, salt

Frozen meal B

Nutrition Facts

1 servings per container

Serving size1 tray (300 g)

Amount per serving

Calories380

% Daily Value*

Total Fat 10g13%

Saturated Fat 2g10%

Trans Fat 0g

Cholesterol 40mg13%

Sodium 480mg21%

Total Carbohydrate 48g17%

Dietary Fiber 7g25%

Total Sugars 5g

Includes Added Sugars 0g0%

Protein 25g

Vitamin D 0mcg0%

Calcium 40mg3%

Iron 1.8mg10%

Potassium 120mg3%

*The % Daily Value (DV) tells you how much a nutrient in a serving of food contributes to a daily diet. 2,000 calories a day is used for general nutrition advice.

Teaching example only. Not a real product label. Displayed percentages are rounded from general adult DVs; protein %DV is not calculated.

Ingredients: Brown rice, chicken, broccoli, beans, olive oil, salt

Common Label-Reading Mistakes

  • Ignoring serving size.
  • Looking only at calories.
  • Adding added sugars to total sugars a second time.
  • Skipping sodium in bread, soup or sauce.
  • Comparing different serving sizes as if equal.
  • Believing a front-package claim without reading the facts.
  • Assuming “organic” or “natural” means a stronger nutrient profile.
  • Assuming one bottle or package is one serving.
  • Ignoring fiber.
  • Forgetting to multiply for multiple servings.

Where Labels Can Mislead You

  • A small snack bag with two servings: the whole bag doubles the labeled amounts.
  • A tiny serving of calorie-dense granola: your bowl may contain much more.
  • A low-calorie cereal that has little fiber and more added sugar.
  • Soup with 800 mg sodium per cup: two cups reach 1,600 mg.
  • Sweetened oatmeal packets: read added sugars, not just the oat claim.
  • A healthy-looking flavored yogurt: compare total and added sugars.
  • “Reduced fat” does not tell you the calories or added sugar.
  • A large drink bottle: check the full-container column or multiply carefully.

A Simple 5-Second Label Check

A quick scan, then slow down if something needs a closer look.

  1. 1. Serving size & servings in the package
  2. 2. Calories for your portion
  3. 3. Sodium
  4. 4. Added sugars; total carbohydrate when relevant
  5. 5. Fiber & protein
  6. 6. Saturated fat
  7. 7. Ingredients & allergens

Check the portion before choosing the product.

Practice Reading Labels

Use these mock examples to build confidence. There is no score or judgment—just a chance to practice.

Soup · lower sodium

Which one-cup soup has less sodium?

A · Soup A · regular

Nutrition Facts

2 servings per container

Serving size1 cup (245 g)

Amount per serving

Calories120

% Daily Value*

Total Fat 3g4%

Saturated Fat 1g5%

Trans Fat 0g

Cholesterol 0mg0%

Sodium 800mg35%

Total Carbohydrate 18g7%

Dietary Fiber 2g7%

Total Sugars 5g

Includes Added Sugars 2g4%

Protein 5g

Vitamin D 0mcg0%

Calcium 40mg3%

Iron 1.8mg10%

Potassium 120mg3%

*The % Daily Value (DV) tells you how much a nutrient in a serving of food contributes to a daily diet. 2,000 calories a day is used for general nutrition advice.

Teaching example only. Not a real product label. Displayed percentages are rounded from general adult DVs; protein %DV is not calculated.

B · Soup B · lower sodium

Nutrition Facts

2 servings per container

Serving size1 cup (245 g)

Amount per serving

Calories110

% Daily Value*

Total Fat 2g3%

Saturated Fat 0.5g3%

Trans Fat 0g

Cholesterol 0mg0%

Sodium 350mg15%

Total Carbohydrate 18g7%

Dietary Fiber 3g11%

Total Sugars 4g

Includes Added Sugars 0g0%

Protein 5g

Vitamin D 0mcg0%

Calcium 40mg3%

Iron 1.8mg10%

Potassium 120mg3%

*The % Daily Value (DV) tells you how much a nutrient in a serving of food contributes to a daily diet. 2,000 calories a day is used for general nutrition advice.

Teaching example only. Not a real product label. Displayed percentages are rounded from general adult DVs; protein %DV is not calculated.

Cereal · more fiber

Which 40 g cereal has more fiber?

A · Cereal A · sweet crunch

Nutrition Facts

1 servings per container

Serving size1 cup (40 g)

Amount per serving

Calories160

% Daily Value*

Total Fat 2g3%

Saturated Fat 0g0%

Trans Fat 0g

Cholesterol 0mg0%

Sodium 180mg8%

Total Carbohydrate 34g12%

Dietary Fiber 1g4%

Total Sugars 12g

Includes Added Sugars 11g22%

Protein 2g

Vitamin D 0mcg0%

Calcium 40mg3%

Iron 1.8mg10%

Potassium 120mg3%

*The % Daily Value (DV) tells you how much a nutrient in a serving of food contributes to a daily diet. 2,000 calories a day is used for general nutrition advice.

Teaching example only. Not a real product label. Displayed percentages are rounded from general adult DVs; protein %DV is not calculated.

B · Cereal B · oat cereal

Nutrition Facts

1 servings per container

Serving size1 cup (40 g)

Amount per serving

Calories150

% Daily Value*

Total Fat 3g4%

Saturated Fat 0.5g3%

Trans Fat 0g

Cholesterol 0mg0%

Sodium 140mg6%

Total Carbohydrate 28g10%

Dietary Fiber 5g18%

Total Sugars 3g

Includes Added Sugars 2g4%

Protein 5g

Vitamin D 0mcg0%

Calcium 40mg3%

Iron 1.8mg10%

Potassium 120mg3%

*The % Daily Value (DV) tells you how much a nutrient in a serving of food contributes to a daily diet. 2,000 calories a day is used for general nutrition advice.

Teaching example only. Not a real product label. Displayed percentages are rounded from general adult DVs; protein %DV is not calculated.

Yogurt · less added sugar

Which yogurt has less added sugar and more protein?

A · Yogurt A · sweetened

Nutrition Facts

1 servings per container

Serving size1 container (170 g)

Amount per serving

Calories150

% Daily Value*

Total Fat 2g3%

Saturated Fat 1g5%

Trans Fat 0g

Cholesterol 10mg3%

Sodium 80mg3%

Total Carbohydrate 23g8%

Dietary Fiber 0g0%

Total Sugars 20g

Includes Added Sugars 12g24%

Protein 10g

Vitamin D 0mcg0%

Calcium 200mg15%

Iron 1.8mg10%

Potassium 240mg5%

*The % Daily Value (DV) tells you how much a nutrient in a serving of food contributes to a daily diet. 2,000 calories a day is used for general nutrition advice.

Teaching example only. Not a real product label. Displayed percentages are rounded from general adult DVs; protein %DV is not calculated.

B · Yogurt B · plain

Nutrition Facts

1 servings per container

Serving size1 container (170 g)

Amount per serving

Calories100

% Daily Value*

Total Fat 0g0%

Saturated Fat 0g0%

Trans Fat 0g

Cholesterol 5mg2%

Sodium 65mg3%

Total Carbohydrate 7g3%

Dietary Fiber 0g0%

Total Sugars 6g

Includes Added Sugars 0g0%

Protein 17g

Vitamin D 0mcg0%

Calcium 190mg15%

Iron 1.8mg10%

Potassium 240mg5%

*The % Daily Value (DV) tells you how much a nutrient in a serving of food contributes to a daily diet. 2,000 calories a day is used for general nutrition advice.

Teaching example only. Not a real product label. Displayed percentages are rounded from general adult DVs; protein %DV is not calculated.

Bread · same portion

Which slice better supports the goals of lower sodium and more fiber?

A · Bread A · soft multigrain

Nutrition Facts

1 servings per container

Serving size1 slice (40 g)

Amount per serving

Calories110

% Daily Value*

Total Fat 1.5g2%

Saturated Fat 0g0%

Trans Fat 0g

Cholesterol 0mg0%

Sodium 210mg9%

Total Carbohydrate 21g8%

Dietary Fiber 1g4%

Total Sugars 4g

Includes Added Sugars 3g6%

Protein 3g

Vitamin D 0mcg0%

Calcium 40mg3%

Iron 1.8mg10%

Potassium 120mg3%

*The % Daily Value (DV) tells you how much a nutrient in a serving of food contributes to a daily diet. 2,000 calories a day is used for general nutrition advice.

Teaching example only. Not a real product label. Displayed percentages are rounded from general adult DVs; protein %DV is not calculated.

B · Bread B · whole wheat

Nutrition Facts

1 servings per container

Serving size1 slice (40 g)

Amount per serving

Calories100

% Daily Value*

Total Fat 1.5g2%

Saturated Fat 0g0%

Trans Fat 0g

Cholesterol 0mg0%

Sodium 120mg5%

Total Carbohydrate 19g7%

Dietary Fiber 3g11%

Total Sugars 2g

Includes Added Sugars 1g2%

Protein 4g

Vitamin D 0mcg0%

Calcium 40mg3%

Iron 1.8mg10%

Potassium 120mg3%

*The % Daily Value (DV) tells you how much a nutrient in a serving of food contributes to a daily diet. 2,000 calories a day is used for general nutrition advice.

Teaching example only. Not a real product label. Displayed percentages are rounded from general adult DVs; protein %DV is not calculated.

Frozen meal · heart-conscious comparison

Which equal-size tray has less saturated fat and sodium?

A · Frozen meal A

Nutrition Facts

1 servings per container

Serving size1 tray (300 g)

Amount per serving

Calories450

% Daily Value*

Total Fat 18g23%

Saturated Fat 7g35%

Trans Fat 0g

Cholesterol 55mg18%

Sodium 1000mg43%

Total Carbohydrate 50g18%

Dietary Fiber 3g11%

Total Sugars 6g

Includes Added Sugars 2g4%

Protein 22g

Vitamin D 0mcg0%

Calcium 40mg3%

Iron 1.8mg10%

Potassium 120mg3%

*The % Daily Value (DV) tells you how much a nutrient in a serving of food contributes to a daily diet. 2,000 calories a day is used for general nutrition advice.

Teaching example only. Not a real product label. Displayed percentages are rounded from general adult DVs; protein %DV is not calculated.

B · Frozen meal B

Nutrition Facts

1 servings per container

Serving size1 tray (300 g)

Amount per serving

Calories380

% Daily Value*

Total Fat 10g13%

Saturated Fat 2g10%

Trans Fat 0g

Cholesterol 40mg13%

Sodium 480mg21%

Total Carbohydrate 48g17%

Dietary Fiber 7g25%

Total Sugars 5g

Includes Added Sugars 0g0%

Protein 25g

Vitamin D 0mcg0%

Calcium 40mg3%

Iron 1.8mg10%

Potassium 120mg3%

*The % Daily Value (DV) tells you how much a nutrient in a serving of food contributes to a daily diet. 2,000 calories a day is used for general nutrition advice.

Teaching example only. Not a real product label. Displayed percentages are rounded from general adult DVs; protein %DV is not calculated.

Snack bar · protein

Which equal-size bar has more protein and less added sugar?

A · Snack bar A

Nutrition Facts

1 servings per container

Serving size1 bar (40 g)

Amount per serving

Calories180

% Daily Value*

Total Fat 7g9%

Saturated Fat 2g10%

Trans Fat 0g

Cholesterol 0mg0%

Sodium 130mg6%

Total Carbohydrate 26g9%

Dietary Fiber 2g7%

Total Sugars 12g

Includes Added Sugars 10g20%

Protein 3g

Vitamin D 0mcg0%

Calcium 40mg3%

Iron 1.8mg10%

Potassium 120mg3%

*The % Daily Value (DV) tells you how much a nutrient in a serving of food contributes to a daily diet. 2,000 calories a day is used for general nutrition advice.

Teaching example only. Not a real product label. Displayed percentages are rounded from general adult DVs; protein %DV is not calculated.

B · Snack bar B

Nutrition Facts

1 servings per container

Serving size1 bar (40 g)

Amount per serving

Calories170

% Daily Value*

Total Fat 7g9%

Saturated Fat 1g5%

Trans Fat 0g

Cholesterol 0mg0%

Sodium 80mg3%

Total Carbohydrate 22g8%

Dietary Fiber 4g14%

Total Sugars 5g

Includes Added Sugars 3g6%

Protein 6g

Vitamin D 0mcg0%

Calcium 40mg3%

Iron 1.8mg10%

Potassium 120mg3%

*The % Daily Value (DV) tells you how much a nutrient in a serving of food contributes to a daily diet. 2,000 calories a day is used for general nutrition advice.

Teaching example only. Not a real product label. Displayed percentages are rounded from general adult DVs; protein %DV is not calculated.

Crackers · calories for the portion

If you eat two servings of Crackers B, is that fewer calories than one serving of Crackers A?

A · Crackers A

Nutrition Facts

1 servings per container

Serving size6 crackers (30 g)

Amount per serving

Calories130

% Daily Value*

Total Fat 4g5%

Saturated Fat 1g5%

Trans Fat 0g

Cholesterol 0mg0%

Sodium 240mg10%

Total Carbohydrate 21g8%

Dietary Fiber 1g4%

Total Sugars 2g

Includes Added Sugars 1g2%

Protein 2g

Vitamin D 0mcg0%

Calcium 40mg3%

Iron 1.8mg10%

Potassium 120mg3%

*The % Daily Value (DV) tells you how much a nutrient in a serving of food contributes to a daily diet. 2,000 calories a day is used for general nutrition advice.

Teaching example only. Not a real product label. Displayed percentages are rounded from general adult DVs; protein %DV is not calculated.

B · Crackers B

Nutrition Facts

1 servings per container

Serving size6 crackers (30 g)

Amount per serving

Calories120

% Daily Value*

Total Fat 3g4%

Saturated Fat 0.5g3%

Trans Fat 0g

Cholesterol 0mg0%

Sodium 100mg4%

Total Carbohydrate 20g7%

Dietary Fiber 3g11%

Total Sugars 1g

Includes Added Sugars 0g0%

Protein 3g

Vitamin D 0mcg0%

Calcium 40mg3%

Iron 1.8mg10%

Potassium 120mg3%

*The % Daily Value (DV) tells you how much a nutrient in a serving of food contributes to a daily diet. 2,000 calories a day is used for general nutrition advice.

Teaching example only. Not a real product label. Displayed percentages are rounded from general adult DVs; protein %DV is not calculated.

Dressing · sodium

Which two-tablespoon dressing has less sodium?

A · Dressing A

Nutrition Facts

1 servings per container

Serving size2 tbsp (30 g)

Amount per serving

Calories120

% Daily Value*

Total Fat 12g15%

Saturated Fat 2g10%

Trans Fat 0g

Cholesterol 0mg0%

Sodium 300mg13%

Total Carbohydrate 4g1%

Dietary Fiber 0g0%

Total Sugars 3g

Includes Added Sugars 2g4%

Protein 0g

Vitamin D 0mcg0%

Calcium 40mg3%

Iron 1.8mg10%

Potassium 120mg3%

*The % Daily Value (DV) tells you how much a nutrient in a serving of food contributes to a daily diet. 2,000 calories a day is used for general nutrition advice.

Teaching example only. Not a real product label. Displayed percentages are rounded from general adult DVs; protein %DV is not calculated.

B · Dressing B

Nutrition Facts

1 servings per container

Serving size2 tbsp (30 g)

Amount per serving

Calories80

% Daily Value*

Total Fat 8g10%

Saturated Fat 1g5%

Trans Fat 0g

Cholesterol 0mg0%

Sodium 100mg4%

Total Carbohydrate 2g1%

Dietary Fiber 0g0%

Total Sugars 1g

Includes Added Sugars 0g0%

Protein 0g

Vitamin D 0mcg0%

Calcium 40mg3%

Iron 1.8mg10%

Potassium 120mg3%

*The % Daily Value (DV) tells you how much a nutrient in a serving of food contributes to a daily diet. 2,000 calories a day is used for general nutrition advice.

Teaching example only. Not a real product label. Displayed percentages are rounded from general adult DVs; protein %DV is not calculated.

Blood-sugar awareness · whole picture

Can either yogurt label alone guarantee a diabetes-friendly choice for every person?

A · Yogurt A · sweetened

Nutrition Facts

1 servings per container

Serving size1 container (170 g)

Amount per serving

Calories150

% Daily Value*

Total Fat 2g3%

Saturated Fat 1g5%

Trans Fat 0g

Cholesterol 10mg3%

Sodium 80mg3%

Total Carbohydrate 23g8%

Dietary Fiber 0g0%

Total Sugars 20g

Includes Added Sugars 12g24%

Protein 10g

Vitamin D 0mcg0%

Calcium 200mg15%

Iron 1.8mg10%

Potassium 240mg5%

*The % Daily Value (DV) tells you how much a nutrient in a serving of food contributes to a daily diet. 2,000 calories a day is used for general nutrition advice.

Teaching example only. Not a real product label. Displayed percentages are rounded from general adult DVs; protein %DV is not calculated.

B · Yogurt B · plain

Nutrition Facts

1 servings per container

Serving size1 container (170 g)

Amount per serving

Calories100

% Daily Value*

Total Fat 0g0%

Saturated Fat 0g0%

Trans Fat 0g

Cholesterol 5mg2%

Sodium 65mg3%

Total Carbohydrate 7g3%

Dietary Fiber 0g0%

Total Sugars 6g

Includes Added Sugars 0g0%

Protein 17g

Vitamin D 0mcg0%

Calcium 190mg15%

Iron 1.8mg10%

Potassium 240mg5%

*The % Daily Value (DV) tells you how much a nutrient in a serving of food contributes to a daily diet. 2,000 calories a day is used for general nutrition advice.

Teaching example only. Not a real product label. Displayed percentages are rounded from general adult DVs; protein %DV is not calculated.

Helpful Label-Reading Tips

  • Always start with serving size.
  • 5% DV or less is low; 20% or more is high.
  • Compare the same weight or intended portion when possible.
  • Check sodium in breads, soups, sauces and frozen meals.
  • Watch added sugars in yogurt, cereal, drinks and snacks.
  • Use fiber to compare similar foods.
  • Protein can help compare breakfast and snack options.
  • Read ingredients; the front of the package is only part of the story.
  • A package can contain several servings even when it looks small.
  • Use labels as a comparison tool, not a source of stress.

What a Stronger Choice Often Looks Like

A stronger choice is a better fit for a particular goal, not a perfect food. Different products can suit different needs. The mock comparisons below show tradeoffs without advertising brands.

  • Bread: more fiber and less sodium for the same slice size.
  • Yogurt: less added sugar and useful protein for the same container size.
  • Cereal: more fiber and less added sugar—not just a low calorie number.
  • Soup, sauce and crackers: lower sodium, while checking fiber and portion.
  • Frozen meals: consider calories, sodium, saturated fat, fiber and protein together.

Use labels with your own health goals

A label is a comparison tool, not a diagnosis or a personal meal prescription. Low added sugar alone does not prove a food is diabetes-friendly.

For blood-sugar planning, look at total carbohydrate for the portion you will eat. Your care team may help you balance meals, medication and personal carbohydrate goals. For kidney disease, sodium, potassium and protein may need tailored guidance.

  • Do not subtract fiber automatically or use “net carbs” as a universal rule.
  • Daily Values are broad label reference values, not your site preset or your clinician’s limit.
  • Packaged foods can be part of a practical eating pattern; there is no need to feel judged.

FDA References & Further Reading

Keep Exploring Healthy Eating

A basket of packaged foods and fresh produce
Packaged foods can fit a thoughtful, practical eating pattern.

Reading a nutrition label is not about perfection. It is about knowing more, comparing more wisely, and making choices that better support your goals. With Healthy Heart Choices, every label becomes another opportunity to choose with confidence.